 Posted by Wall Tools
Construction is a volatile industry in good times, and it can be downright nightmarish in the worst times. There are so many different factors that can affect the construction industry, and the factors change depending on where you are.
We decided to check with the experts to find out how things are going, where business is booming, and what the outlook is for the industry.
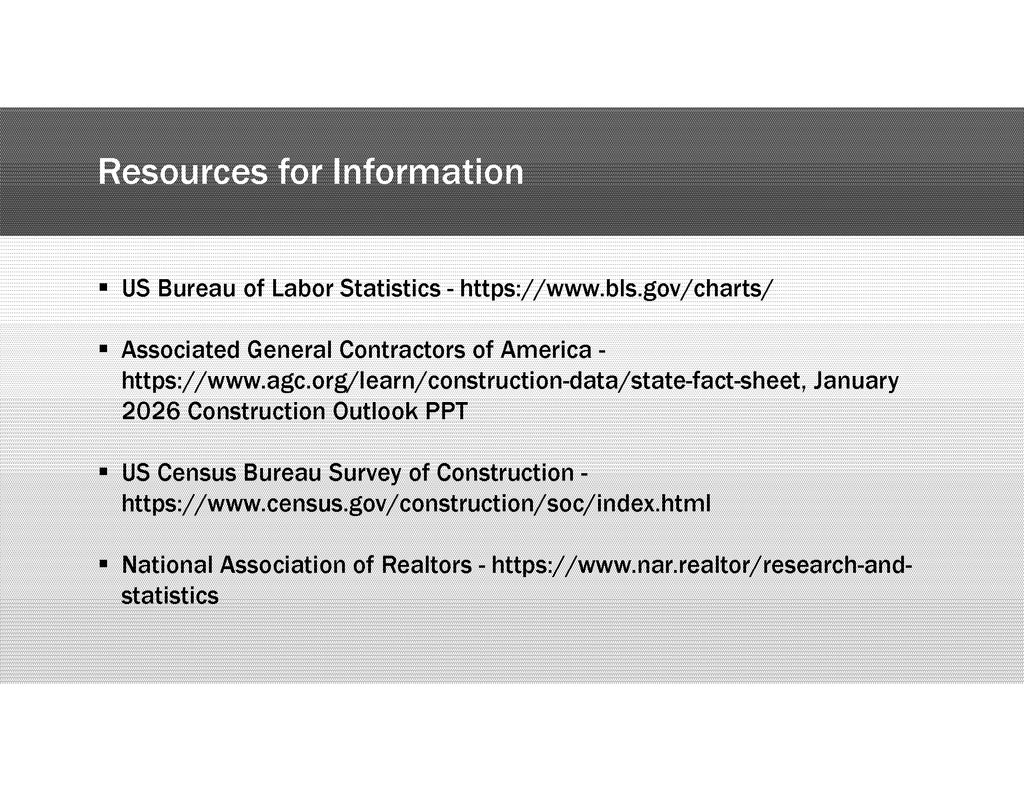
We collected data from the Associated General Contractors of America, the National Association of Realtors, the US Census Bureau Survey of Construction, and the US Bureau of Labor Statistics and put together a general report on the state of the construction industry.
DEMOGRAPHICS
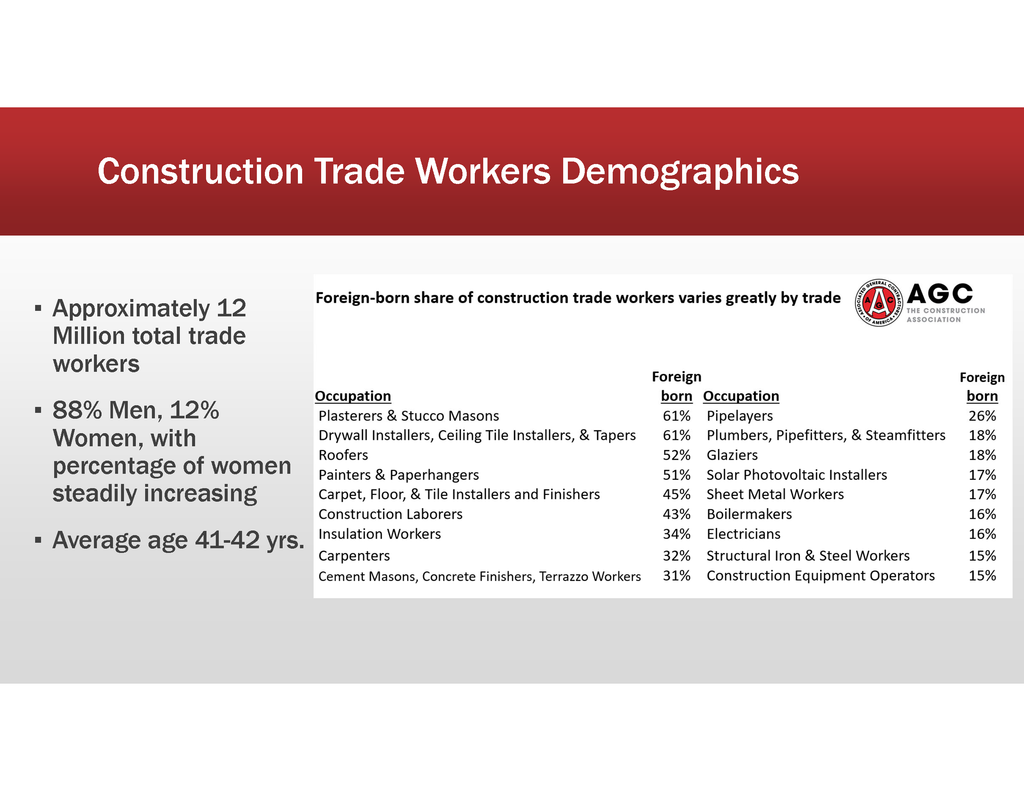
The US Construction Industry employs more than 12 Million trade workers. Men account for approximately 88% of these workers, but the number of women in each trade can vary greatly. One of the largest challenges in maintaining skilled trade workers is that the average worker’s age is between 41 and 42 years old.
CONSTRUCTION EMPLOYMENT LEVELS
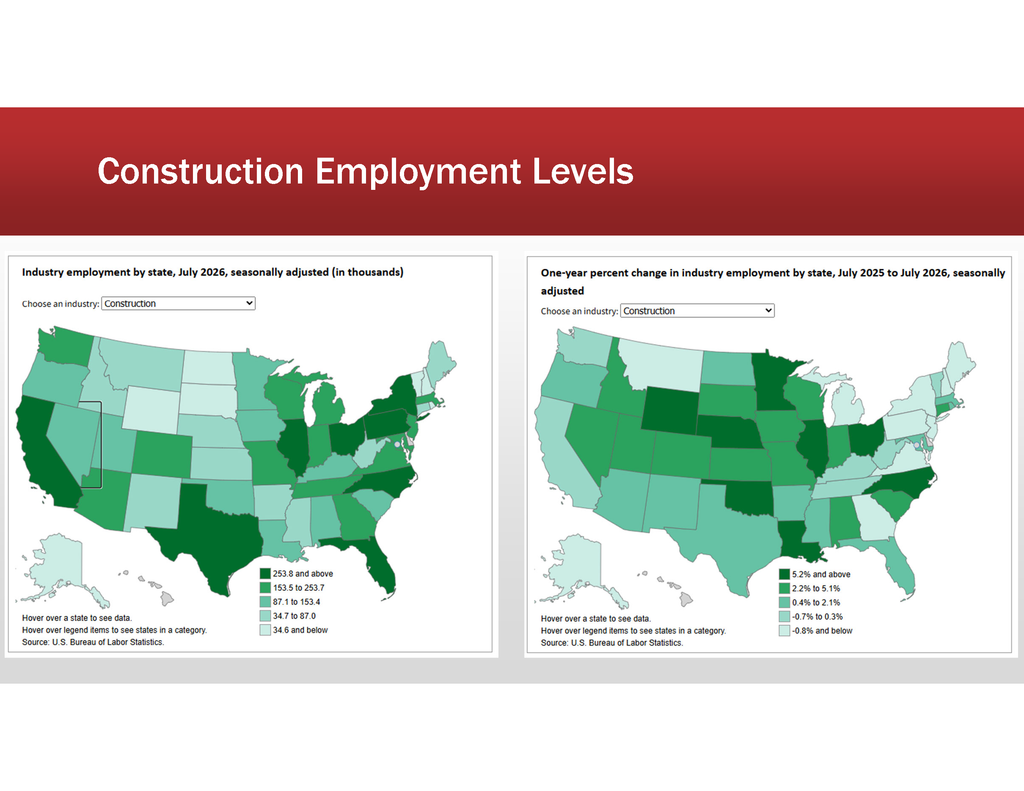
The first map (on the left) below shows where these trade workers are employed. The darker each state is, the more construction workers are employed there. However, this map seems to correlate with general population, so it is not a good indication alone of the overall health of any one area. When we combine it with the information with the second map (on the right), we can actually see that the highly populated areas are seeing declines in construction employment, while areas in the middle of the country and in the plains are seeing growth.
CONSTRUCITON JOB GROWTH
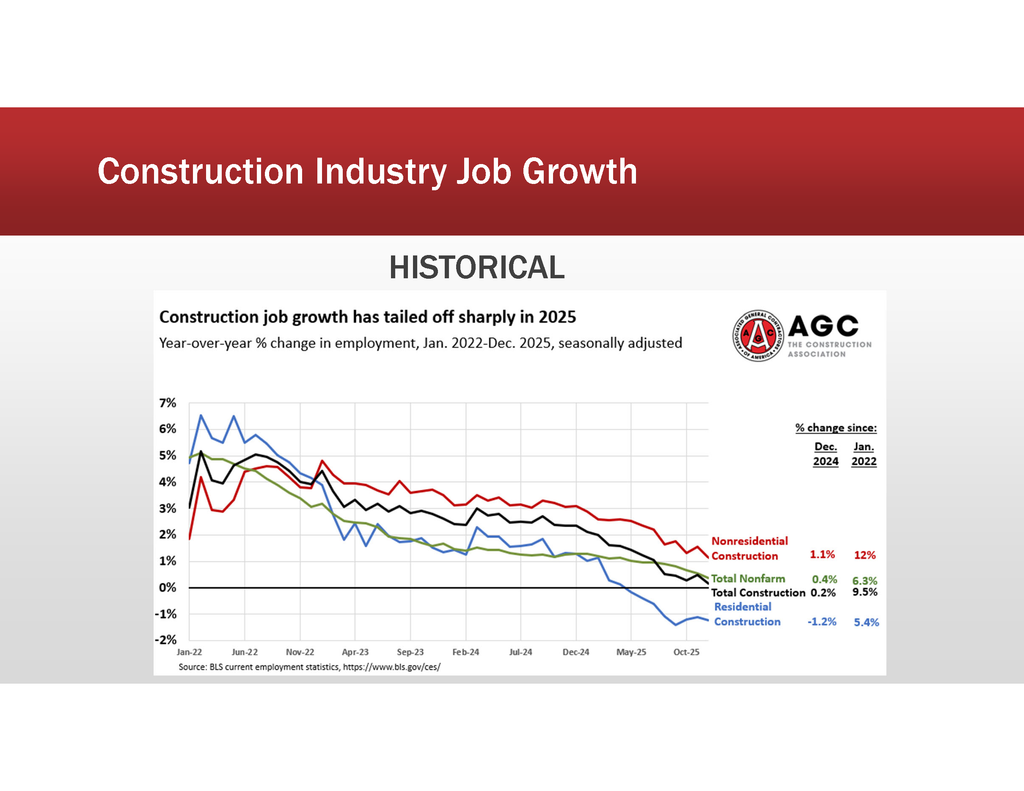
Construction went a little crazy in 2020, and things just haven’t seemed to settle down since then. Construction industry employment have seen decreases in employment levels over the last several years. The housing industry is still trying to catch up to demand, but commercial construction hasn’t improved either. The second map below also supports that there is growth in the Midwest and Plains, but that coastal areas are seeing large declines in employment levels.

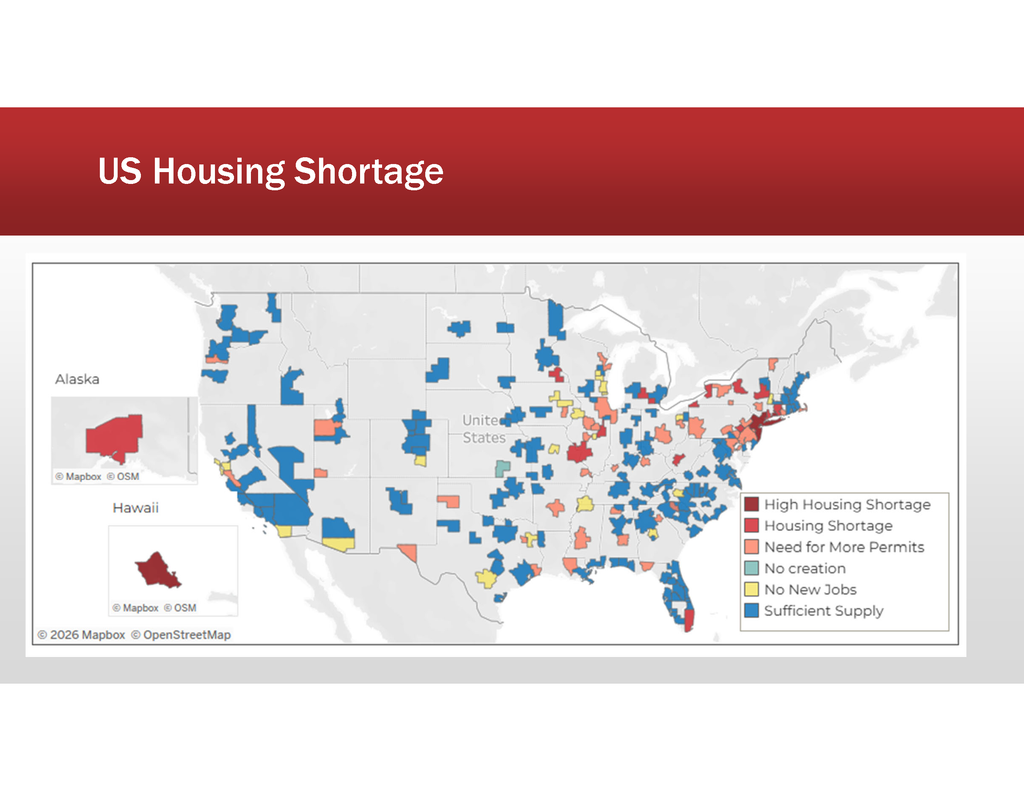
US HOUSING SHORTAGE MAP
The map below was created by the National Association of Realtors as an overview of the nation’s housing levels of the top metropolitan areas. It helps show a more granular view of where more housing is most needed, which can indicate the areas with the most opportunity for new projects.
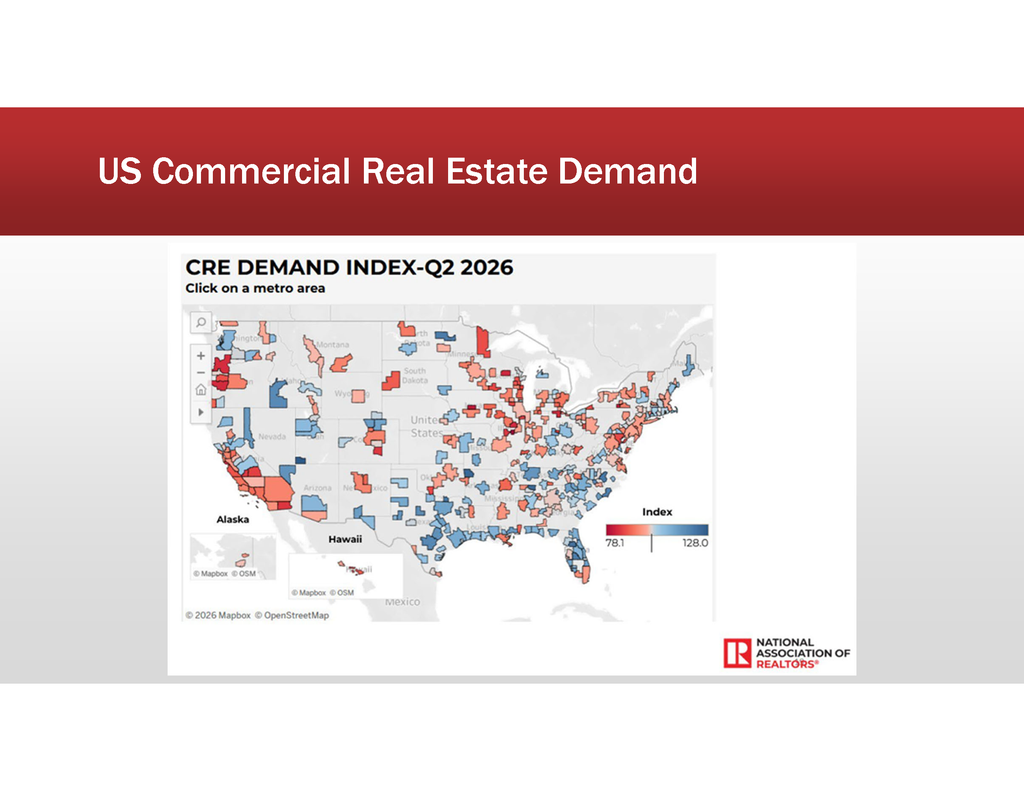
US COMMERCIAL REAL ESTATE DEMAND
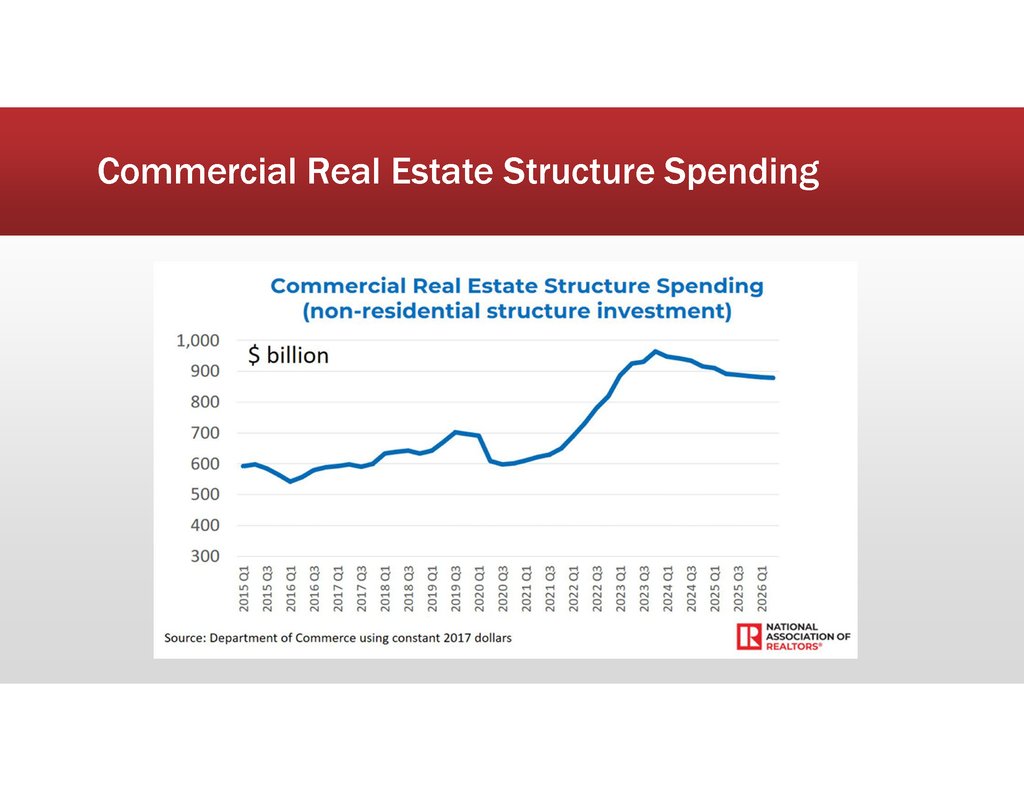
The commercial real estate market is most negative on the West Coast, New England, and in the Rust Belt areas. But, there does appear to be spots of significant growth in the South, lower Appalachia, and in the Salt Lake region. The graph below the map shows that commercial construction spending had a sharp increase between 2022 and 2024, but has since continued to slowly decline, overall.
US POLICY IMPACTS ON CONSTRUCTION
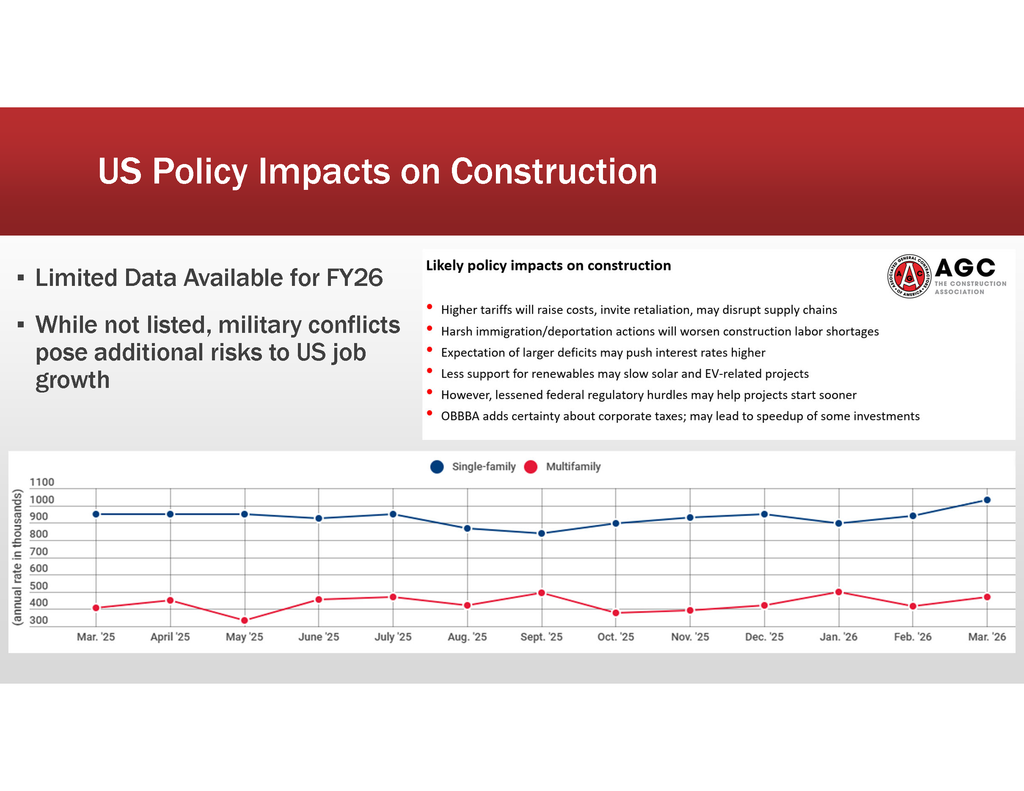
Many different factors affect the overall health and future of construction work in the US, and it can sometimes be hard to put a number on those things. But, it is still important to make note of them and understand how each factor can impact your business. If you know the factors that affect your area, it can help in planning for future jobs.
RESIDENTIAL FORECAST AND EMERGING MARKETS
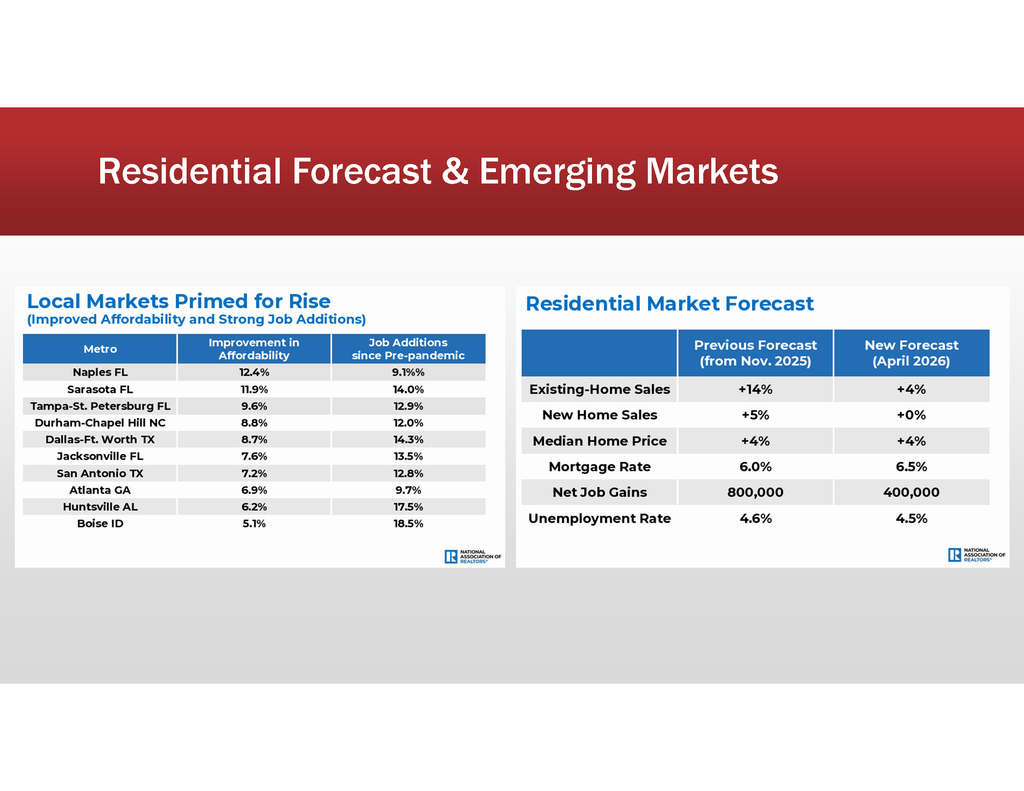
The NAR has released their most recent list of residential markets that are expecting short-term growth, and almost all of them are in the South. The South has historically had regular natural disasters, and this can create a constant need for skilled construction laborers. Other areas are becoming tech hotspots, which is driving a faster need for more housing and driving up existing prices.
CONSTRUCTION SPENDING TRENDS
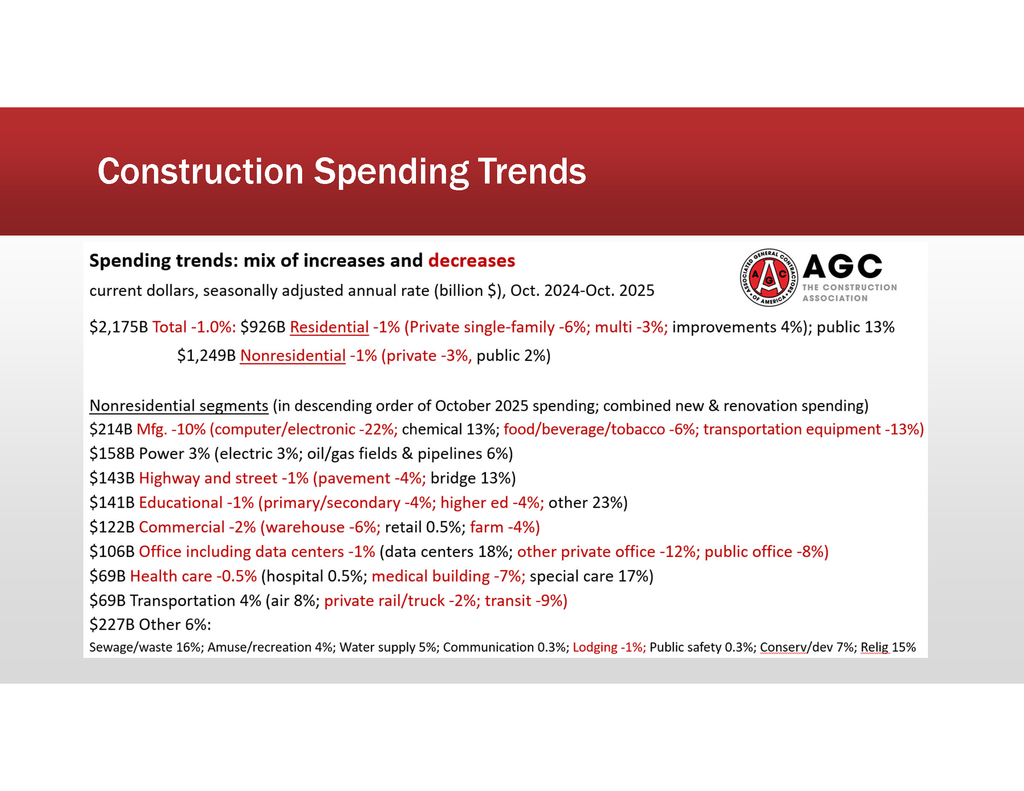
Between 2024 and 2025, construction spending decreased in almost every category except power facilities, infrastructure, and data centers. Overall, it seems like a minor loss, but when the data centers are removed from these numbers, it shows that there is a significant decline in all other areas of construction.